
Open your OS task manager and count the Chrome processes. There are more of them than you have tabs. Add up the memory column and you get a number big enough to write an angry post about.
That number is probably right. It's also useless.
Most writing on "why does Chrome use so much RAM" skips both honest answers. First: the figure people quote can't be attributed to anything. Forty processes called "Chrome," and nothing in that window says which tab, iframe, or extension owns which row. Second: the memory Chrome does use is mostly a deliberate purchase, and the biggest line item is a decision made in the weeks after Spectre went public — give every site its own operating system process. Chrome isn't leaking. It's spending on your behalf, on things you'd approve of if anyone told you the price.
Go and look at that window properly, on a browser that's been open since this morning. Ctrl+Shift+Esc on Windows, Details tab, click Memory to sort; Activity Monitor on macOS, Memory tab, same click. What you get is a column of rows named chrome.exe, or on macOS a stack of Google Chrome Helper (Renderer), ordered worst offender down, and none of them carries a URL or a name you'd recognize.
So pick the top row and say what it's doing. You can't, and neither can I, and that gap is where the folklore grows. People blame whatever they can see: the tab that's on screen when the fans spin up, or the extension they installed last week. The row at the top is just as likely to be a cross-site iframe three ads deep in a tab nobody has looked at since Tuesday. Before you can argue about whether Chrome uses too much memory, you have to be able to say what any single row of it bought you, and the tool everyone reaches for first is the one that structurally can't tell you.
The double-counting debunk is wrong on Windows and macOS
The standard debunk goes like this: your OS reports resident set size, RSS counts every shared page once per process, and Chrome maps a lot of shared pages (the binary, system libraries, V8's startup snapshot, font data). So summing that column inflates the total.
Good argument. Wrong about the two platforms most people reading this are on.
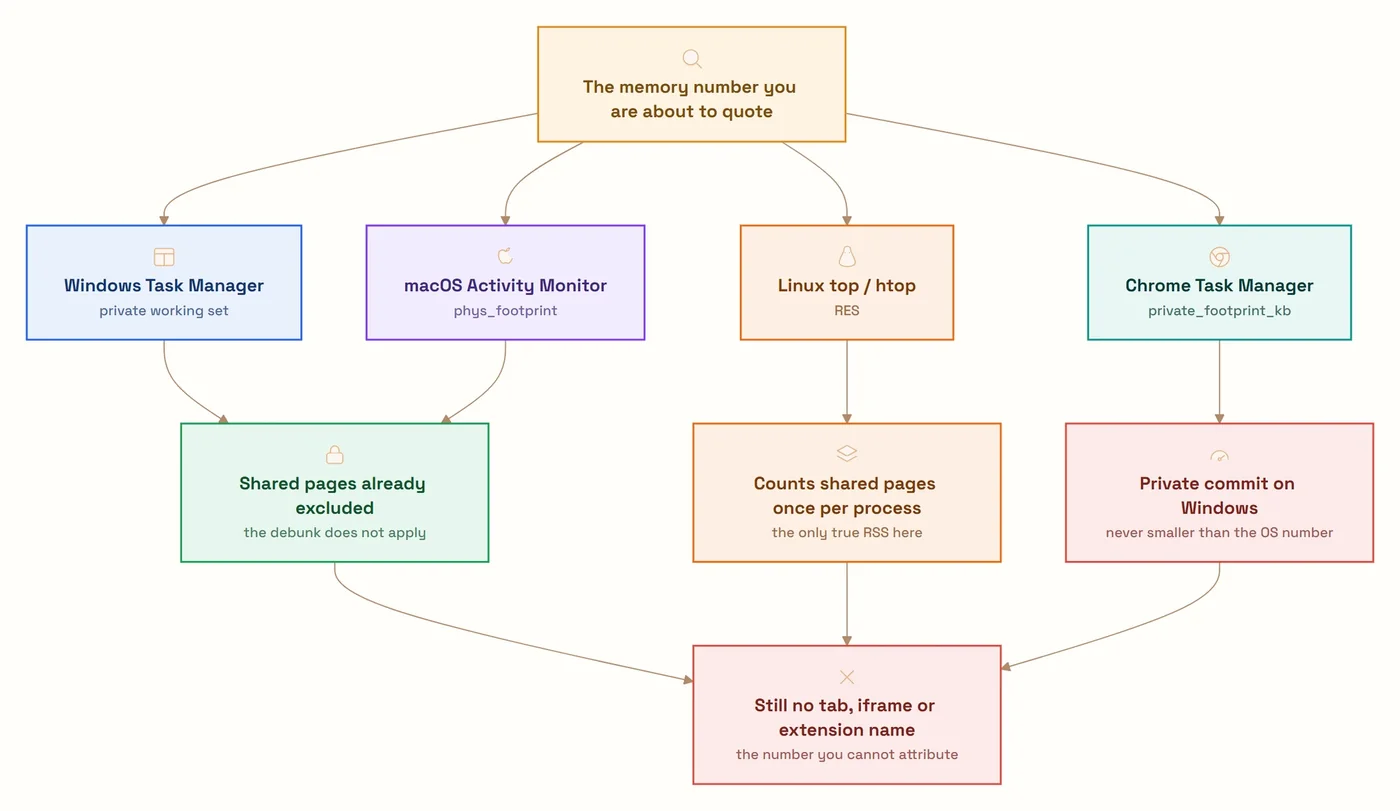
Windows Task Manager's Memory column, on both the Processes and Details tabs, shows the private working set: private allocations currently in RAM, with shared DLLs and shared Chrome pages already excluded. macOS Activity Monitor's Memory column is phys_footprint, also a private metric — the column that reports resident_size is called "Real Memory," and you have to go turn it on. Only Linux top and htop with their RES column, and ps RSS, give you the thing the debunk is about.
It gets worse for the argument. Chrome's own Task Manager reports private_footprint_kb, which on Windows resolves to private_bytes: private commit, counting allocations whether they're sitting in RAM or out in the page file. Commit is never smaller than the private working set. Microsoft's Edge team documents this directly for the same Chromium code — the browser task manager "shows the commit size for a process," the Windows one "shows the private working set."
So the advice everyone gives, stop using your OS task manager and use the browser's, frequently makes the number go up.
The folklore isn't invented from nothing. Chromium's memory usage backgrounder has said for years that summing total working sets "double-counts the shared memory used by each process," enough that Chromium would "appear to be 10-50MB larger than it really is." Still true of total working set, and never a description of the column Windows shows you by default. It dates from when about:memory did the arithmetic itself.
What Chrome's number means is spelled out in memory_instrumentation.mojom: private_footprint_kb is "roughly private, anonymous, non-discardable, resident or swapped memory," which per platform means private_bytes on Windows, phys_footprint_bytes on macOS, and rss_anon_bytes + vm_swap_bytes on Linux, Android and ChromeOS. Read "or swapped" twice. A renderer whose pages got compressed or paged out still reports its full footprint, so the number doesn't drop the moment the pressure does. Treat it as a rough ceiling on what killing that process would hand back, not as RAM you'd actually get.
None of these numbers convert into each other. "Chrome uses 2GB on my Mac and 3.5GB on my PC" compares phys_footprint against private commit. Cross-platform memory comparisons are noise, and so is any benchmark table that doesn't say which metric it sampled.
Shift+Esc is for the names, not the number
The case for Chrome's own Task Manager was never that its total is truer. It's that the rows have names. Chrome labels every process: this tab, that extension, this subframe, the GPU process, the network service. Your OS labels forty of them "Google Chrome." When something is on fire, attribution is the whole problem, and only one of these two tools solves it.
While you're in there, right-click the column header and add "JavaScript memory." It shows the reserved V8 heap with the live, reachable bytes in parentheses. Those two numbers are routinely far apart, and I'll get to why. For a real investigation, chrome://memory-internals can turn on heap profiling and save a dump straight to a file, which Chromium's own tooling docs recommend over routing it through chrome://tracing, because the tracing renderer has a habit of running out of memory while you're measuring memory.
Site Isolation is the bill, and Spectre is what you bought
Chrome's default process model on desktop is Full Site Isolation, also written site-per-process. The thing that actually gets handed a process is the SiteInstance, though Chromium's docs now file the mode named after it, "process-per-site-instance," under historical modes. The allocation unit survived; the mode isn't the default. A "site" means scheme plus eTLD+1, so https://example.com rather than https://app.example.com, and since Chrome 67 that boundary covers every site on desktop, not just a chosen few.
The boundary is site-shaped rather than origin-shaped because of document.domain, and that answer has expired. Since Chrome 115 the setter is a no-op by default: pages get origin-keyed agent clusters, and assigning to it silently does nothing. What keeps the site-level boundary alive is the escape hatch. A page can send Origin-Agent-Cluster: ?0 to get site-keyed clusters and a working setter back, and Chrome still has to honor that. Going the other way, Origin-Agent-Cluster: ?1 asks for origin-level isolation, but it's a hint. You can request it; you can't count on it.
None of this was a performance decision. Site Isolation answers a class of attack where the process boundary is the only boundary that holds. Chrome's Site Isolation documentation names three threats it mitigates: compromised renderer processes (arbitrary code execution in the renderer), universal cross-site scripting bugs, and side channels such as Spectre. Speculative execution lets a renderer read memory it was never granted, so the fix isn't to check permissions more carefully. It's making sure the other site's data was never in that address space.
The cost is documented, and it's smaller than the folklore suggests: "about 10-13%" memory overhead on desktop, measured by Chrome's security team in Chrome 67 with many tabs open. On Android in Chrome 77, isolating only the sites users log into cost "about 3-5%."
On mobile the tradeoff is still rationed. Site Isolation needs roughly 2GB of device RAM to run at all on Android. From Chrome 77 it covered sites users log into; Chrome 92 extended that to sites using third-party login providers like OAuth, and to sites sending a non-default Cross-Origin-Opener-Policy header. Isolating every site on Android arrived later as an Advanced Protection feature, and only on devices with 4GB or more RAM: "when Advanced Protection is off, Chrome will only isolate a site if a user logs into that site, or if the user submits a form on that site." Desktop gets all sites. Your phone gets what its RAM can pay for.
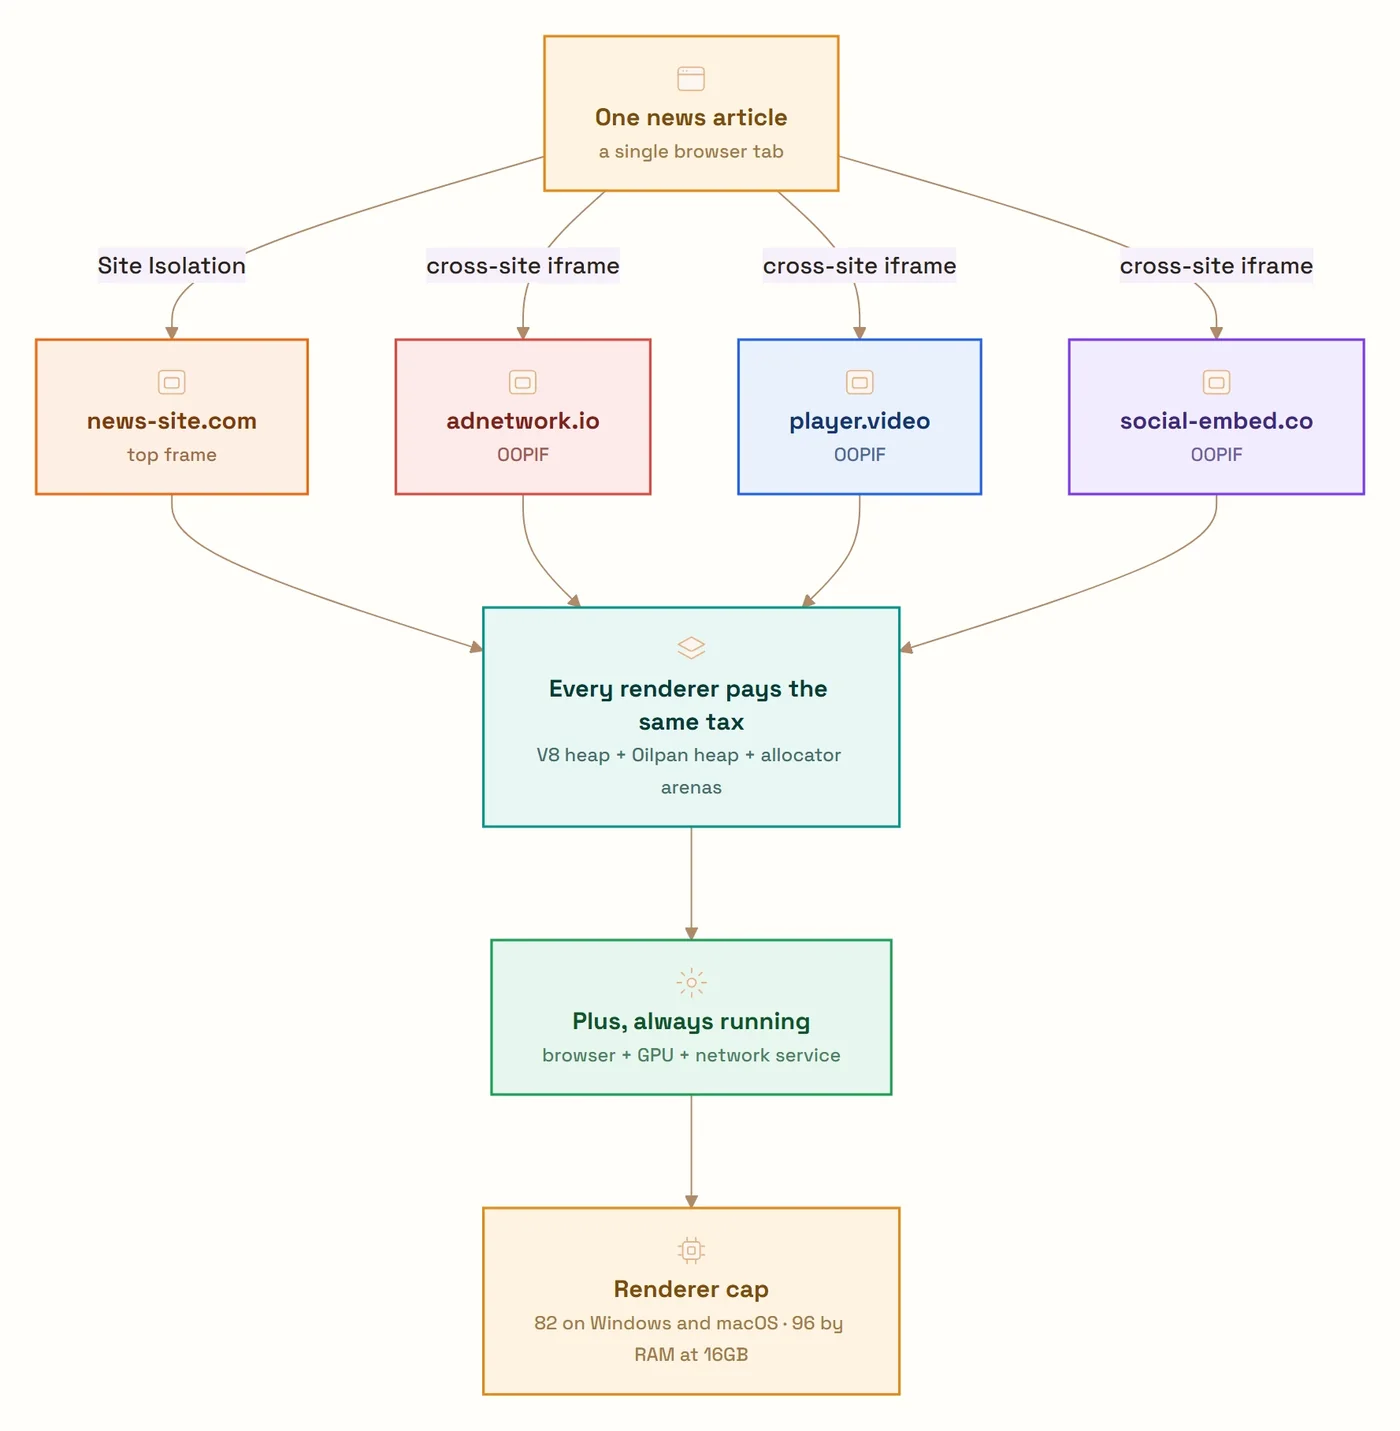
What inflates process counts on real pages is the second-order effect. Cross-site iframes get their own processes too, as out-of-process iframes (OOPIFs), so a news article with three ad networks, an embedded video, and a social widget is five or six renderers before you've finished the first paragraph. Chrome does reuse processes aggressively for iframes, on the stated assumption that "most iframes/fenced frames are less resource demanding than top-level documents," but the floor is still well above one.
I'll say the obvious part first: on a machine with headroom this is one of the easiest trades in the browser. Ten to thirteen percent is overhead you'd hand over for a mediocre feature, and what it buys is the only boundary that still holds when the renderer itself is the thing that's compromised. There's no argument to have there.
The argument lives at the low end, and Chrome has already conceded the principle. The Android rules are rationing, written down: nothing under 2GB, then sites you log into, then OAuth providers and form submissions, then every site at 4GB with Advanced Protection on. Someone sat down and decided which sites are worth a process on a constrained device. Desktop never had that conversation. It's site-per-process for every ad iframe whether the machine has 32GB or 4, and the only lever a low-RAM desktop user is offered is --disable-site-isolation-trials, which turns the whole thing off. I'd take Android's tiering ported upward over that choice any day. The disagreement worth having isn't whether to ration, it's that on desktop nobody has drawn a line at all.
The process cap is a constant in the source, and it isn't 96
Chrome doesn't spawn renderers forever. render_process_host_impl.cc carries a constant, kEstimatedWebContentsMemoryUsage, currently 85 (MB) on 64-bit builds and 60 on 32-bit. The comment explains the heuristic plainly: the calculation "assumes that the renderers will use up to half of the installed RAM and assumes that each WebContents uses kEstimatedWebContentsMemoryUsage MB."
The arithmetic is half your physical memory divided by that constant, clamped between a minimum of 3 and a platform maximum. The comment's table puts a 16GB 64-bit machine at 96 renderers, but that's the ceiling from available RAM alone, before the clamp. The platform side comes from GetPlatformProcessLimit(), which is only implemented on Linux and ChromeOS, where it reads RLIMIT_NPROC. Everywhere else it returns "unknown" and Chrome falls back to kMaxRendererProcessCount, 82. So a 16GB machine tops out at 96 on Linux and 82 on Windows or macOS. The 96 you see quoted everywhere is a number two of the three desktop platforms never reach.
And 85 isn't a measurement of what a tab costs. It's the figure Chrome uses to decide when to stop making processes.
Past the limit Chrome reuses renderers, but only ones it's allowed to reuse. Site Isolation locks a renderer to a site, so the process hosting example.com can't take in other.com. Reopening sites you already have open is close to free; a session that keeps opening genuinely new sites keeps making processes, limit or no limit. The cap doesn't flatten memory growth, only growth from duplicates, which is a much narrower claim than the one people repeat.
Chrome also keeps a spare renderer warm: an already-launched, unlocked process sitting idle so the next navigation doesn't pay process-startup latency. Memory spent purely on responsiveness. chrome://process-internals won't tell you which one is the spare, but it will give you the live renderer count, the process limit and whether you're over it, plus per-frame process IDs, SiteInstance and BrowsingInstance IDs, each process's lock URL, and the isolated-origin list.
Why a JavaScript heap is always bigger than your data
V8's heap is generational, and the young generation is a semi-space collector. As V8's own writeup puts it, "half of the total space is always empty, to allow for this evacuation step." That's not waste. That's the mechanism. The scavenger copies surviving objects from From-Space to To-Space and updates the pointers that referenced them, with marking, evacuation, and pointer-updating "all interleaved, rather than in distinct phases." Objects that survive a second collection get promoted into the old generation.
So the young generation is structurally at least twice the live young data. That's the price of a copying collector that finishes in a few milliseconds instead of stalling a frame.
The old generation is collected by Mark-Compact (mark, sweep, compact), and Chrome only compacts "some highly fragmented pages," sweeping the rest. Sweeping makes space reusable by V8. It does not necessarily hand pages back to the operating system, which is exactly why your JS heap can look enormous right after you've dropped a big data structure. Marking runs concurrently on background threads while your JavaScript executes, and Chrome opportunistically schedules GC work in idle time between frames, since at 60fps there's roughly 16.6ms per frame and some of it is usually free.
Representation costs too. V8's pointer compression work found that "tagged values occupy around 70% of the V8 heap": pointers and small integers carrying type bits, eight bytes each on 64-bit before compression. Shrinking them to four cut V8 heap size by up to 43% on real sites, and up to 20% off Chrome's renderer memory on desktop. Compressed pointers can only address 4GB, which gets written up as the price Chrome paid. It isn't. Chrome was already capping the V8 heap in the low single-digit gigabytes beforehand, so a browser tab lost nothing; the ceiling bites other embedders. If you've ever hit a heap wall in Node on a machine with plenty of free RAM, that's the constraint.
Measuring your own page without lying to yourself
Don't reach for performance.memory. The WICG explainer for its replacement is blunt about why: it "may greatly overestimate the actual memory usage if other large web pages share the same heap," and "may greatly underestimate the actual memory usage if the web page spawns workers and/or embeds cross-site iframes that are allocated in separate heaps." The values Chrome hands back are quantized too, so a precise byte count can't be used as a side channel. You can turn that off with --enable-precise-memory-info, which is not a flag you can ask your users to set.
Use performance.measureUserAgentSpecificMemory() instead. On by default since Chrome 89, it takes the other route: rather than blurring its output, it requires cross-origin isolation and reports real numbers to pages that have shut the side channel themselves.
Cross-Origin-Opener-Policy: same-origin
Cross-Origin-Embedder-Policy: require-corp
Two lines, and a site-wide migration wearing the costume of a header change. COEP: require-corp blocks every cross-origin subresource that doesn't send CORP or CORS: third-party images, CDN scripts, web fonts, analytics beacons, the ad tag someone added in 2019 that nobody owns. COOP: same-origin severs window.opener, the exact channel OAuth popups and hosted payment flows use to talk back. COEP: credentialless, in Chrome since 96, is the gentler variant: it fetches no-CORS cross-origin subresources without credentials instead of blocking them, which is fine for public CDN assets and fatal for anything that needed a cookie. And COOP: same-origin-allow-popups does not get you cross-origin isolation, however much you'd like it to. Ship it to staging, watch your error rate, then decide whether the measurement is worth it.
// Requires a secure, cross-origin isolated context.
// The promise resolves after the next GC, so a call can take seconds.
async function sampleMemory() {
  if (!self.crossOriginIsolated) {
    throw new Error("Not cross-origin isolated: set COOP and COEP headers.");
  }
  if (!performance.measureUserAgentSpecificMemory) {
    throw new Error("API unavailable in this browser.");
  }
  const result = await performance.measureUserAgentSpecificMemory();
  console.log("total bytes:", result.bytes);
  for (const entry of result.breakdown) {
    if (entry.bytes > 0) {
      console.log(entry.bytes, entry.types.join("+"), entry.attribution);
    }
  }
  return result;
}
The breakdown is the reason to bother. It covers the page plus its iframes and workers, and splits the result by type and owner instead of handing you one undifferentiated heap number.
Read attribution and types before you read result.bytes. Attribution tells you which document, iframe, or worker an entry belongs to; types tell you what kind of memory it is. Those are the two questions performance.memory can't answer at all, and answering them is the entire point of paying the COOP/COEP tax.
Expect the total to come in above the data you believe you're holding, and don't treat that as a finding. A V8 heap reserves space it isn't currently using — the empty semi-space, the swept pages it hasn't returned — so "bigger than my objects" is the normal state, not a leak. What you're actually looking for is which entry grows between two samples of the same user flow, and by how much. The failure mode with one opaque number is that it moves, you can't attribute the movement to anything, and you spend a week optimizing whichever allocation you happened to suspect.
The DOM doesn't live in the JavaScript heap
A <div> is a C++ object. Since 2015, Blink has allocated DOM objects inheriting from Node on Oilpan, its own garbage-collected C++ heap, and V8 traces it jointly through cross-component tracing so the tangled C++/JavaScript object graph is collected as one graph rather than two that keep each other alive. Rendering objects went the same way: LayoutObject is GarbageCollected now too, so the layout tree isn't sitting in malloc either.
Underneath all of it sits PartitionAlloc, which splits allocations into isolated partitions in separate address spaces, puts guard pages at the edges of each region, and keeps metadata out-of-line. Blink's wtf/allocator/partitions.h declares three: ArrayBufferPartition(), BufferPartition(), and FastMallocPartition(). Keeping ArrayBuffer backing stores, the one allocation whose every byte a web page controls directly, out of the partition holding Blink's own buffers is the whole idea.
One correction, because it gets repeated: within a partition, buckets are size classes, not type classes. Two unrelated C++ objects that happen to be the same size share a bucket and can recycle each other's memory. The boundary that holds is the partition, not the bucket.
All of that costs address space and some slack. It buys the property that an overflow in one partition can't reach into another, and that grooming the heap into an attacker-useful shape takes real work instead of luck. Same trade as Site Isolation, one layer down: memory for exploitability.
Extensions cost memory where you aren't looking
The folklore is "every extension is a process." The truth is more annoying.
Extension documents and workers (popup, options page, offscreen document, MV3 service worker) run in a dedicated privileged renderer, one per extension. Content scripts don't. Chromium's own security documentation frames it as a problem rather than a feature: content scripts "pose a challenge for Site Isolation, because they run in the same Chrome renderer process as the web page they operate on." They live in a V8 isolated world inside that process.
That flips the cost model. A content-script-only extension with an idle MV3 service worker (which unloads after about 30 seconds of inactivity) may hold no process of its own at all. But every tab it matches pays for an extra isolated world, a second set of DOM wrappers, and whatever the script allocates, multiplied by tab count. Ten extensions with broad matches patterns across forty tabs is four hundred running copies of somebody's script, not ten processes.
When you audit, sort Chrome's Task Manager by memory footprint and read both ends. Extension rows tell you about background pages and popups. Unexpectedly fat renderers for simple pages tell you about content scripts.
If you want the figure for your own setup, measure the page, not the extension. Open something you keep open all day, note its renderer row in Shift+Esc, then load the same URL in a clean profile or an incognito window (extensions are off there unless you explicitly allowed them) and read the same row again. Same page, same logged-in state, or you're comparing two different documents. The delta is what your content scripts cost on that one page, and you pay it again per tab.
Nothing in that measurement appears under an extension's name, which is why extension blame lands wrong in both directions. The ones with a visible row take the heat for memory you can at least see, while a quiet content script matching <all_urls> never shows up as itself. It shows up as your tabs being expensive.
Some of the "waste" is a cache you'd be furious to lose
Chrome deliberately keeps dead pages alive.
The back/forward cache stores "a snapshot of the entire page in memory, including the JavaScript heap," with pending timers and unresolved promises paused. That's what makes the back button instant instead of a network round trip. Memory spent as a latency cache, and it gets discarded after a period to reclaim it.
Memory Saver, shipped in Chrome 108, goes the other way: it proactively discards tabs that have gone unused in the background. Discarding is genuinely destructive. The page "is gone, exactly as if the tab had been closed normally," and it reloads when you come back. Two consequences if you build web apps: document.wasDiscarded will be true on that reload, and beforeunload, pagehide, and unload do not fire when a tab is discarded, so none of them are safe places to persist state. Since late 2024 the aggressiveness has been user-selectable (Moderate, Balanced, Maximum) under chrome://settings/performance.
Freezing is a different lever, and it gets confused with discarding constantly. From Chrome 133, eligible CPU-intensive background tabs are frozen under Energy Saver: task execution suspends, event handlers stop, state is preserved, and the tab unfreezes when you return with queued tasks running as if nothing happened. Frozen tabs still hold their full memory. Freezing buys battery. Discarding buys RAM.
Where the criticism is fair
I've spent this post defending Chrome's memory use, so here's the other side, because some of the complaints are correct.
Chrome treats free RAM as a resource to consume, and its notion of "free" is a heuristic tuned for a machine where the browser is the main event. On a 16GB laptop also running an IDE, a container runtime, and a chat client, that assumption is wrong, and the first symptom is memory compression or swap rather than any Chrome number going up. The process-limit formula budgets half of installed RAM to renderers before it starts economizing at all.
The isolation granularity is a real compromise too. Because a "site" is scheme plus eTLD+1, you pay full per-process cost while getting a boundary coarser than the origin boundary most developers assume they have. Two different origins on the same registrable domain can still share a process. You're paying origin-level prices for site-level guarantees, and the gap now persists to keep the Origin-Agent-Cluster: ?0 opt-out working rather than because anyone thinks it's ideal.
And the discard heuristics are opaque. A tab that gets discarded and then immediately reloaded costs a network round trip, a full parse, and battery, in exchange for memory you might not have been short of. Chrome doesn't show its work, and there's no way to reason about the decision beyond squinting at chrome://discards.
My actual position: the quantity is mostly defensible and the accounting is not. Chrome spends memory on things users would sign off on — security boundaries, instant back navigation, warm processes — and then reports it through an interface that makes it look like a leak. The real complaint was never "8GB." It's that nobody can tell you what the 8GB bought.
How I'd actually read the numbers
- Use Shift+Esc for attribution, not for a smaller total. Sort by Memory footprint, add the JavaScript memory column, and watch the gap between reserved and live.
- Never compare that total against one from a different OS. That's private commit versus
phys_footprintversus RSS. Compare a machine to itself, before and after. - Check
chrome://discardsbefore blaming Chrome for hoarding tabs. A good chunk of the apparent "leak" is often frozen or already-discarded tabs you're reading wrong. - For your own app, instrument with
performance.measureUserAgentSpecificMemory()and treat the breakdown as the signal. Roll its COOP/COEP headers through staging first; cross-origin isolation breaks third-party subresources and popup auth.performance.memorywill mislead you in both directions and won't tell you which one. - On 8GB, set Memory Saver to Maximum and accept the reloads. On 32GB, set it to Moderate and stop opening Task Manager.
- Don't disable Site Isolation. Whatever you save is worth less than what you're switching off.
Caveats
- Version-specific numbers move. The 10-13% desktop and 3-5% Android overhead figures come from Chrome 67 and Chrome 77 measurements respectively. Those are the numbers Chrome's security team published, and I haven't found updated ones. Treat them as order-of-magnitude rather than current.
kEstimatedWebContentsMemoryUsage,kMaxRendererProcessCount, and the RAM-to-process table in the comment have all changed over Chromium's history, more than once. Read the currentrender_process_host_impl.ccrather than trusting any blog post, this one included.- What a "Memory" column means is an OS-version detail, not a law. The Windows private-working-set and macOS
phys_footprintbehavior above is current as of mid-2026. Confirm before building an argument on it. - Android Site Isolation coverage has expanded repeatedly (Chrome 77, Chrome 92, and again alongside Advanced Protection). If you're reasoning about mobile, check the current Site Isolation page against your Chrome version.
- Everything above describes desktop Chrome. Chrome on Android, Chrome on iOS (which runs WebKit), and Android WebView have materially different process models, and WebView doesn't get Site Isolation at all.
Frequently asked questions
- Why does Chrome open more processes than I have tabs?
- Because tabs aren't the unit of process allocation. Chrome runs a browser process, a GPU process, a network service, assorted utility processes, a renderer per site instance, a separate renderer for cross-site iframes (OOPIFs), and a privileged renderer for each extension whose pages or service worker are currently alive. A single ad-heavy news article can occupy five or six renderers on its own.
- Is Chrome really using 8GB, or is Task Manager lying to me?
- Probably really using it. Windows Task Manager's Memory column shows the private working set, and macOS Activity Monitor's shows
phys_footprint— both already exclude shared pages, so the double-counting story you've read doesn't apply there. It does apply to Linuxtop/htop, whoseREScolumn is true RSS. Chrome's own Task Manager (Shift+Esc on Windows and Linux, Window → Task Manager on macOS) reports a private footprint that on Windows is private commit, so it often reads higher than the OS number, not lower. Use it for attribution — which tab, which extension — not for a smaller total. - Can I turn off Site Isolation to save memory?
- You can, via
chrome://flagsor the--disable-site-isolation-trialsswitch, and I'd strongly advise against it. Site Isolation is what stops a compromised renderer process, a universal XSS bug, or a Spectre-class side channel from reading another site's data out of a shared address space. You'd be trading roughly 10-13% memory for the mitigation Chrome shipped specifically in response to Spectre. - Does Memory Saver actually reclaim memory?
- Yes, because discarding is real: the page is destroyed and its renderer goes away, leaving only the tab strip entry. That's different from freezing, which suspends task execution in background tabs to save CPU and battery while the page stays fully resident in RAM. If you're chasing memory rather than battery life, discarding is the mechanism that matters. Check which tabs are in which state at
chrome://discards. - Why is my JavaScript heap so much bigger than the data I'm holding?
- Three structural reasons. V8's young generation is a semi-space collector, so half of that region is always empty to allow evacuation. The old generation is swept rather than fully compacted on every cycle, so freed space becomes reusable by V8 without necessarily returning to the OS. And tagged values, meaning pointers and small integers carrying type bits, make up around 70% of the heap. The Task Manager's JavaScript memory column shows both figures: reserved heap, with live bytes in parentheses.
- Does every Chrome extension get its own process?
- Not exactly, and this is the most common thing people get wrong. Extension documents and workers (popup, options page, offscreen document, MV3 service worker) run in a dedicated privileged renderer, one per extension. Extension content scripts run inside the renderer of the page they're injected into. So a content-script-only extension with a dormant service worker may hold no process of its own at all, while still costing memory in every tab it touches.